Functional Connectivity
Our brain works through a series of networks. Each network is made up of spatially distributed, but functionally linked, regions that continuously share information with each other. This is known as functional connectivity and it is measured by fMRI when the patient is lying quietly and still in the scanner. This is known as resting state fMRI.
A computer-generated image of one of the brain networks, known as the Default Mode Network, appears below:
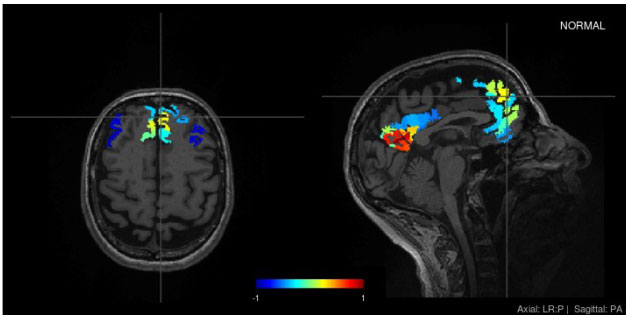
This is an image of the Default Mode Network in a healthy normal person Two regions in this network will be considered to show functional connectivity if there is a correlation in the activity between them. The correlation may be positive or negative. If two regions show heightened activity at the same time, they are considered to be positively correlated. If one region shows increased activity while at the same time another region shows decreased activity, they are considered to be negatively correlated.
In the graphic above, the intensity of each color indicates the strength of the correlations. Within the dark red and dark blue regions, neural activity is strongly correlated. The dark red areas are negatively correlated with the dark blue areas. The paler colors show areas that more weakly correlated but still part of the network.
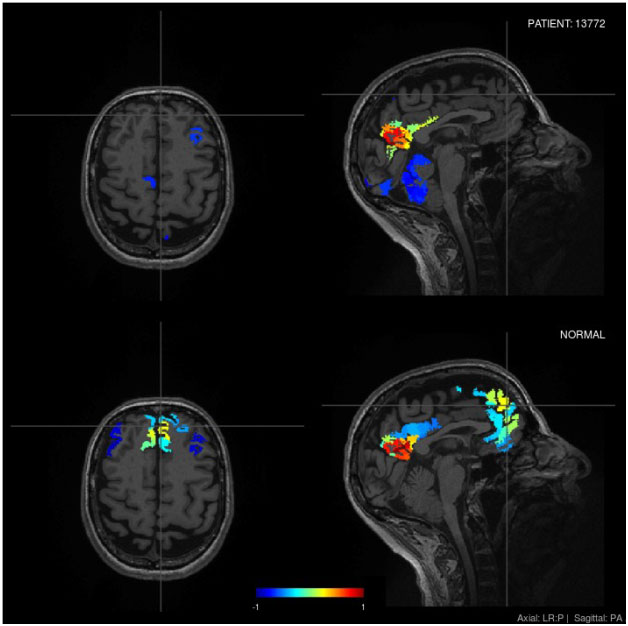
When there has been a brain injury, connectivity within a network may fall outside of the normal range. Functional MRI can detect this.
The graphic below illustrates the Default Mode Network of a person who has had a brain injury (top panel) compared to the same network in a healthy person (bottom panel):